Cell Biology
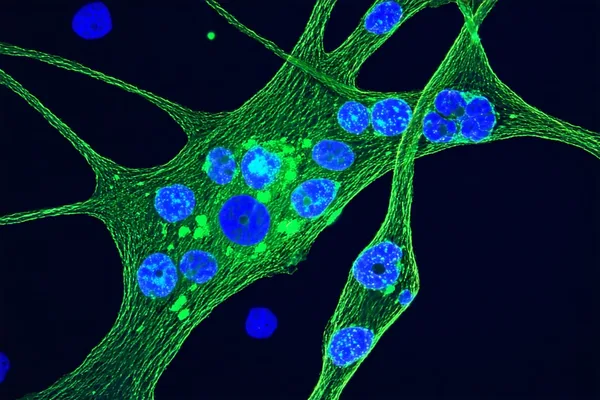
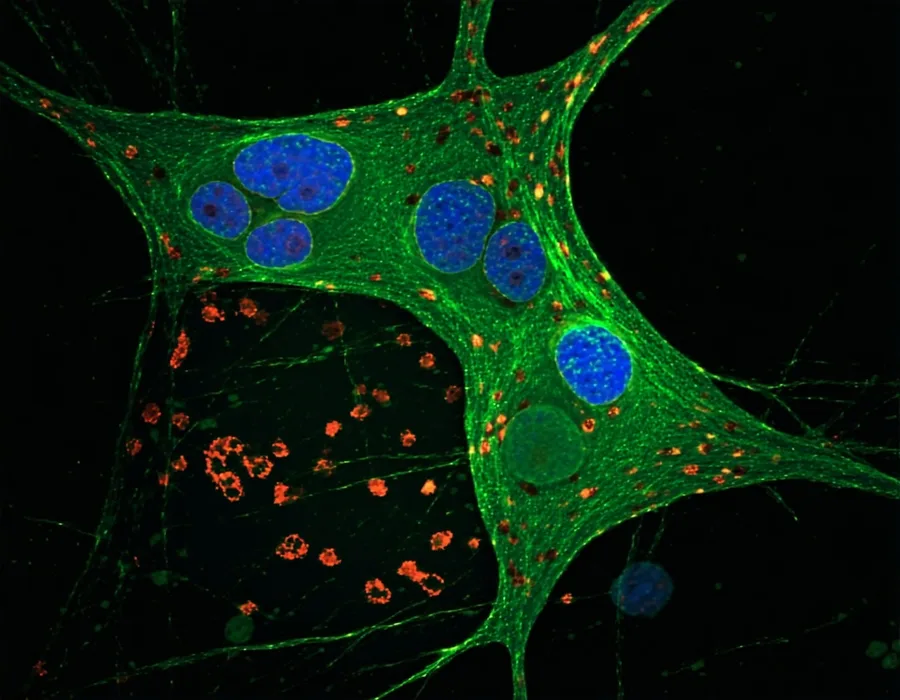
Fluorescence quantification for cell cycle, morphology, and signaling pathway analysis.
Learn moreCytely standardizes fluorescence microscopy data before analysis — eliminating inter-instrument variability so your quantitative results mean the same thing everywhere.
Platform
Cytely corrects systematic sources of intensity variability at the acquisition level — flatfield bias, background offset, and cross-instrument gain — before any segmentation or quantification sees the data.
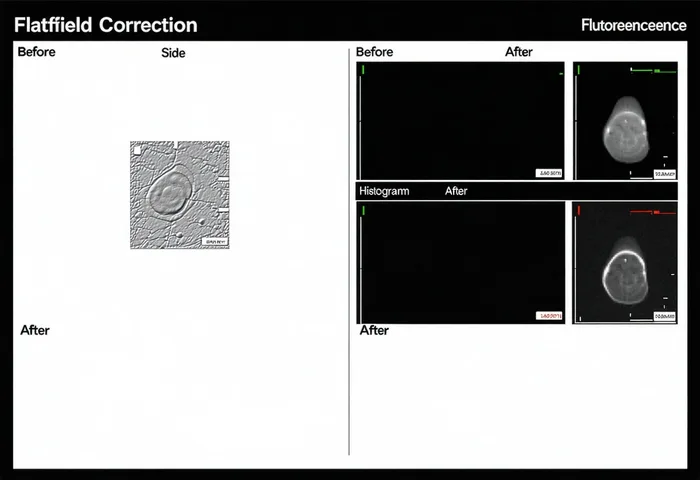
Non-uniform illumination introduces spatial intensity bias that is invisible to the eye but measurable in quantification. Cytely applies automated flatfield correction from reference acquisitions or empirical background estimation — correcting intensity gradients across the field of view before any measurement is made.
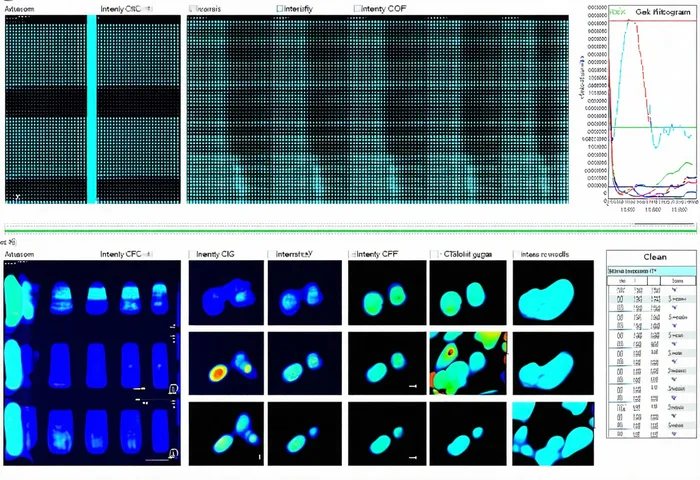
Fluorescence intensity values are instrument-dependent: detector gain, laser power calibration, and filter transmission differ between systems. Cytely's normalization module maps intensity distributions to a common reference frame — making measurements from a ZEISS LSM 980 directly comparable to those from a Leica STELLARIS.
Standardized images export as analysis-ready data in your existing pipeline's expected format. All per-image, per-well, and per-plate metadata is preserved. Compatible with CellProfiler, MATLAB, Python, and FIJI — Cytely slots in before your analysis, not instead of it.
Applications
Standardization is relevant wherever fluorescence microscopy data are compared across conditions, sites, or time points.
Fluorescence quantification for cell cycle, morphology, and signaling pathway analysis.
Learn more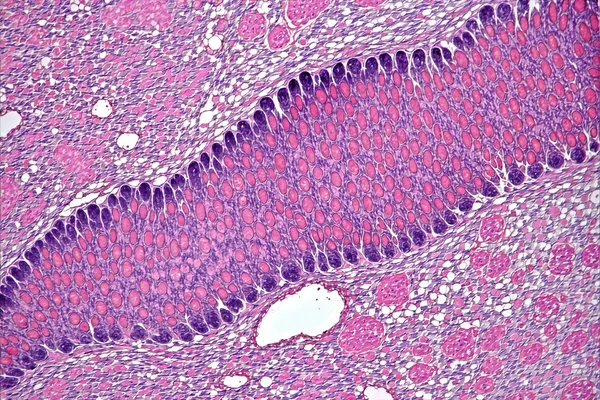
H&E and IHC tissue section analysis with standardized stain intensity across scanning platforms.
Learn more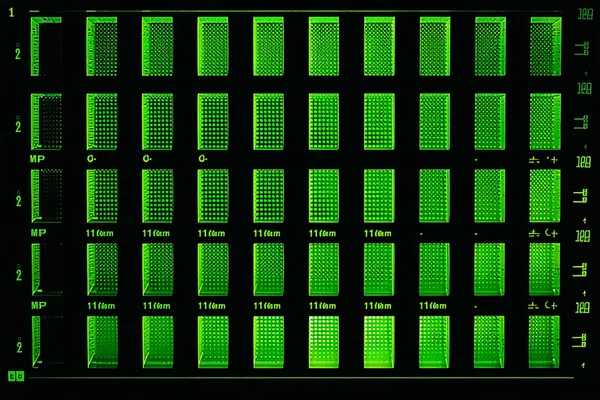
96-well and 384-well HCS assay standardization for reproducible Z' factors across imaging systems.
Learn more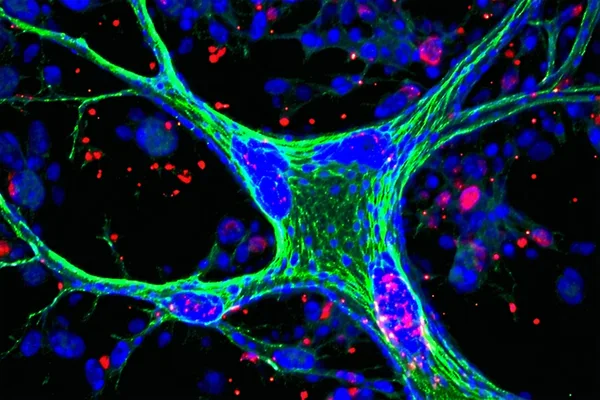
Confocal z-stack standardization for neurite tracing and synaptic puncta quantification.
Learn moreQuantitative fluorescence standardization enables cross-laboratory comparison of cell morphology phenotypes
Reproducible HCS assay development using intensity-normalized fluorescence imaging
Inter-instrument variability in confocal fluorescence quantification: sources, magnitude, and mitigation
Flatfield correction protocols for quantitative widefield fluorescence in multi-site studies
Standardized image analysis pipeline reduces variability in multi-center drug discovery HCS campaigns
A validated protocol for cross-instrument intensity normalization in live-cell fluorescence microscopy
Workflow
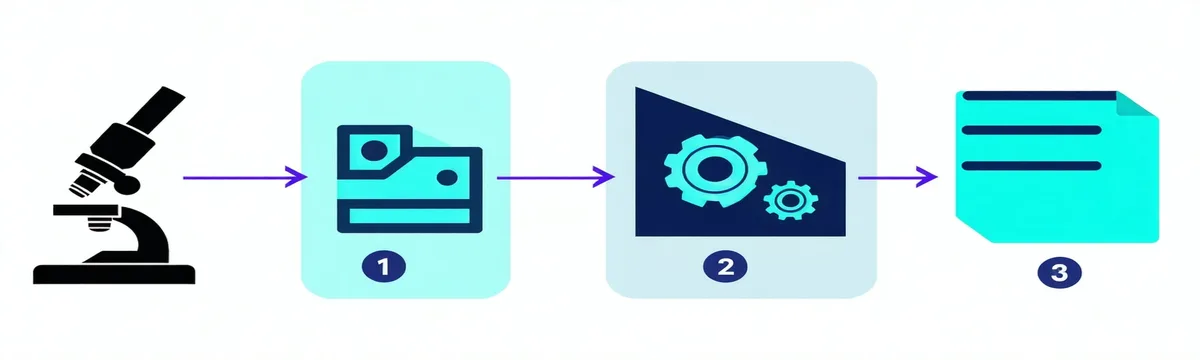
Open images directly from your acquisition system in their native format. No pre-export or format conversion required.
TIFF
CZI
LIF
ND2
IMS
OME-TIFF
Flatfield correction, background subtraction, and cross-instrument intensity normalization execute in sequence. Protocol parameters save per instrument configuration — apply the same corrections to every subsequent acquisition session.
Standardized images export as OME-TIFF or standard TIFF with per-image metadata intact. CellProfiler, MATLAB, Python, and FIJI receive data that is now comparable across acquisition sessions.
Compatible with major fluorescence platforms and downstream analysis tools. Cytely reads native file formats — no image export or conversion required.
Microscope platforms
Analysis software
Compatibility refers to native file format support and data export compatibility. Cytely is independent software, not affiliated with instrument manufacturers.
Cytely eliminated the instrument-to-instrument variability that was making our multi-site study results inconsistent. We can now pool data from three different microscope models.
Our high-content screening assays now produce reproducible Z' factors regardless of which imaging system we run them on. Cytely has become a fixed step in our HCS pipeline.
The flatfield correction and background normalization routines alone made our longitudinal study publishable. Reviewers commented specifically on the standardization methodology.
Request a demonstration using images from your instrument setup. Our application scientists will walk through the correction results with you.