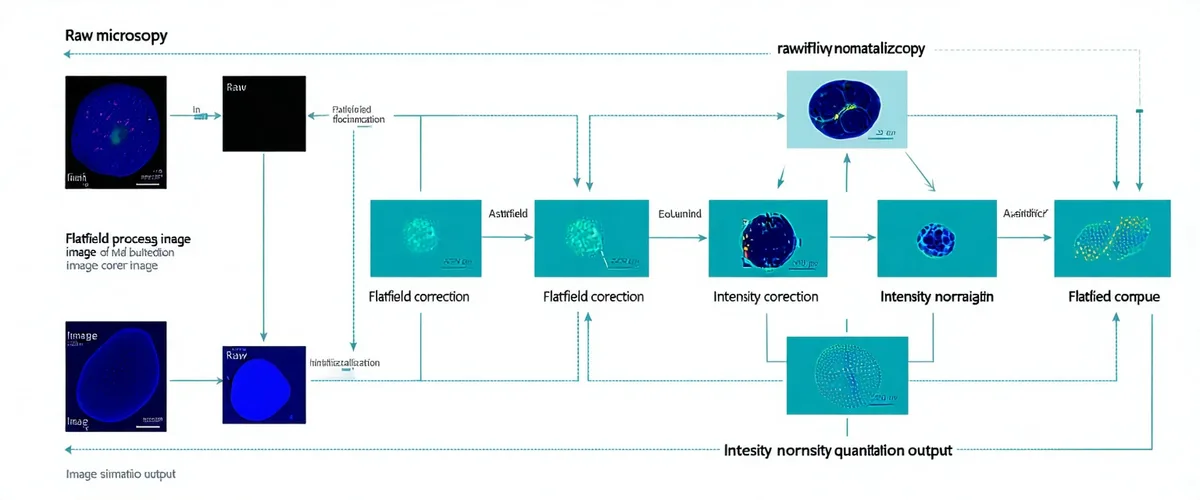
Image Standardization
Flatfield correction, background subtraction, illumination normalization. Removes spatial and intensity bias at the acquisition level before any downstream quantification.
Module detailsA standardization layer that integrates before your existing image analysis pipeline — delivering reproducible quantitative outputs across instruments, sites, and time points.
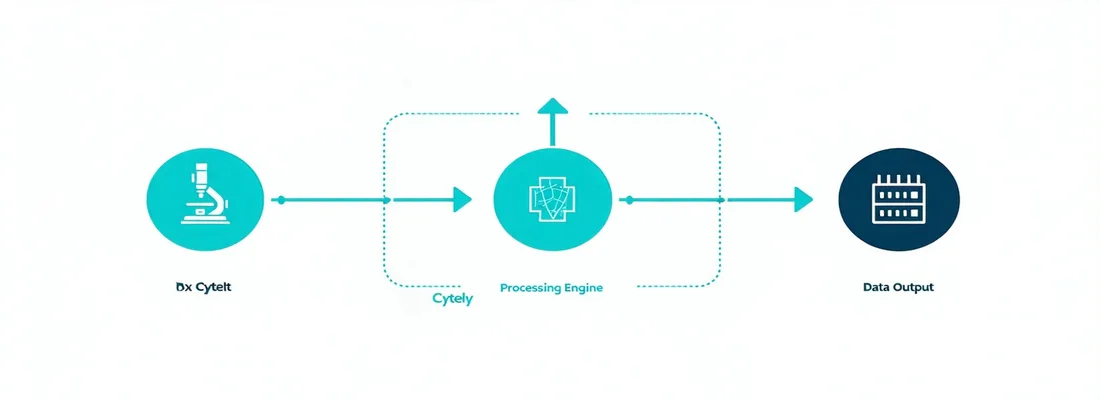
Architecture
The Analysis Engine processes images in a sequential, auditable pipeline. Each stage can be configured and saved as a protocol for your specific instrument setup.
Modules
Cytely's modular architecture lets you apply exactly the correction steps relevant to your workflow.
Flatfield correction, background subtraction, illumination normalization. Removes spatial and intensity bias at the acquisition level before any downstream quantification.
Module detailsCell and object segmentation, feature extraction, biomarker intensity quantification. Outputs structured per-object data tables compatible with CellProfiler, MATLAB, and Python.
Module detailsHigh-throughput plate-reader and HCS-compatible batch processing. Handles 96-well, 384-well, and custom plate formats with per-well quality control reporting.
Module detailsTechnical Specifications
| Category | Specification | Notes |
|---|---|---|
| Operating system | Windows 10/11 (64-bit), macOS 12+, Ubuntu 20.04+ | Linux requires glibc 2.31+ |
| RAM (recommended) | 16 GB minimum; 32 GB for batch HCS workflows | Large z-stack sets benefit from 64 GB+ |
| File formats (input) | TIFF, CZI, LIF, ND2, IMS, VSI, OIB, OME-TIFF |
Via Bio-Formats reader integration |
| Output formats | OME-TIFF, TIFF, CSV, HDF5 |
Per-image, per-well, per-plate summaries |
| API interface | Python SDK (pip), MATLAB toolbox, REST API (Lab license+) | Python 3.9+; MATLAB R2022a+ |
| Plugin interfaces | FIJI/ImageJ plugin, CellProfiler module | Available in Lab and Commercial tiers |
| License delivery | License key via email; node-locked or floating (Commercial) | Annual renewal; offline activation available |
| Validation documentation | IQ/OQ/PQ support package (Commercial tier) | GxP-ready audit trail available as add-on |
Reproducibility
Intensity coefficient of variation (CV%) across three confocal systems measuring the same DAPI-stained slide, with and without Cytely standardization. Residual CV after correction reflects biological heterogeneity within the sample, not instrument variability.
Without Cytely
With Cytely
Representative data from internal validation studies. Results vary by sample type and imaging conditions.
Our application scientists can advise on the appropriate correction strategy for your instrument configuration — confocal, widefield, HCS platform, or mixed fleet.